


Ecommerce customer journey mapping is the practice of laying out every step a shopper takes with an online store — from the first time they encounter the brand to the point where they recommend it to someone else. The point is to see the store the way customers actually experience it, then remove the friction that quietly costs sales.
What a customer journey map covers:
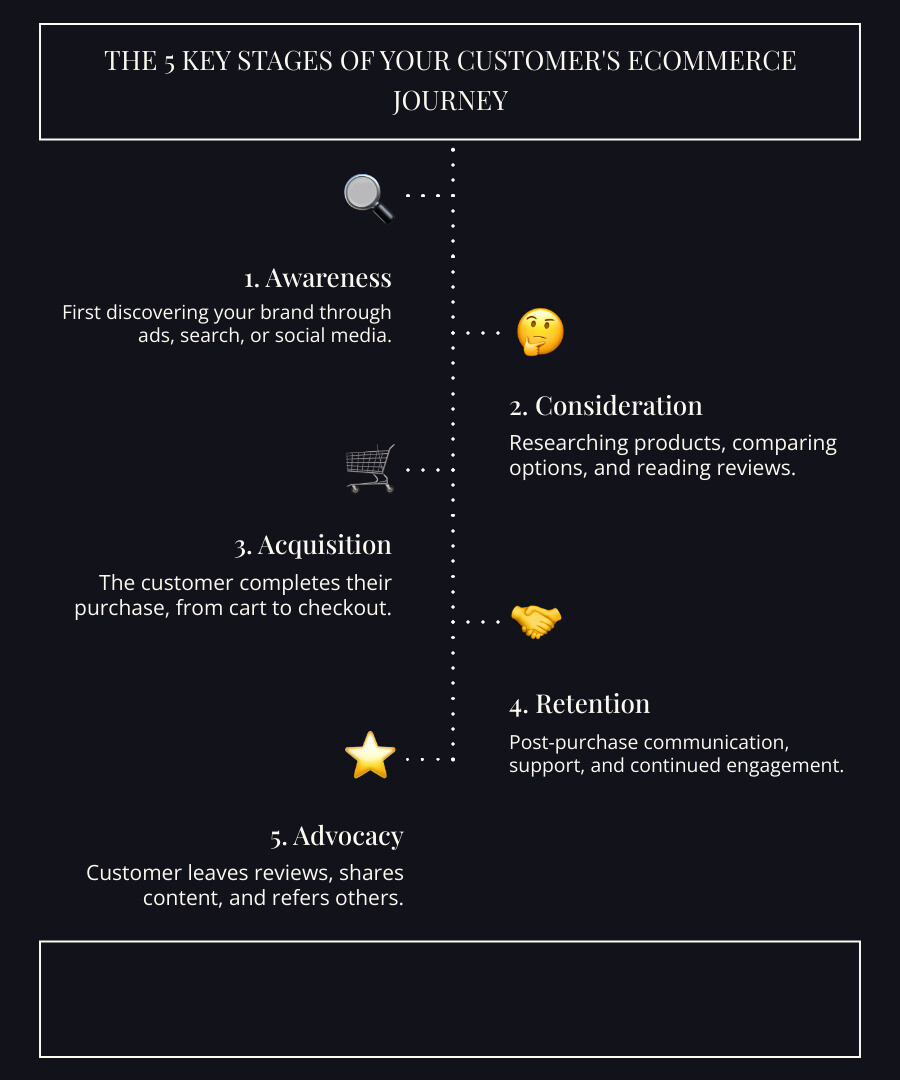
- Five stages: awareness, consideration, acquisition, retention, and advocacy
- Touchpoints: every interaction between shopper and brand, online and off
- Pain points: the friction that causes people to abandon a purchase
- Data: quantitative analytics paired with qualitative feedback
- The map itself: a single view of actions, emotions, and obstacles at each stage
Roughly 70% of online shopping carts are abandoned before checkout, according to Baymard Institute, which aggregates dozens of cart-abandonment studies. Most of that loss is avoidable. A journey map is how a store finds the specific points where shoppers give up — and what to fix first.
What an ecommerce customer journey map is
A customer journey map is a visual record of a shopper's full experience, from first contact to post-purchase review. It tracks more than clicks — it captures what customers are trying to do at each step and where the experience helps or hinders them. A shopper might like a product but abandon a confusing checkout; the map is what surfaces that gap so it can be addressed with evidence instead of guesswork.
Why it matters
The customer experience behaves like a chain: one broken link sends a buyer to a competitor, often without the store ever learning why. Mapping the journey turns that blind spot into something concrete.
The payoff shows up in three places. Conversion improves when friction is removed, because an easier path to purchase means fewer drop-offs. Alignment improves because marketing, support, and development teams work from the same picture of what customers actually go through. And retention compounds the effect: research by Bain & Company found that increasing customer retention by 5% can raise profits anywhere from 25% to 95%, since returning customers cost less to convert and tend to spend more over time. Salesforce has likewise reported that a large majority of high-performing marketing teams consider a customer journey strategy central to their results.
The five stages of the ecommerce customer experience
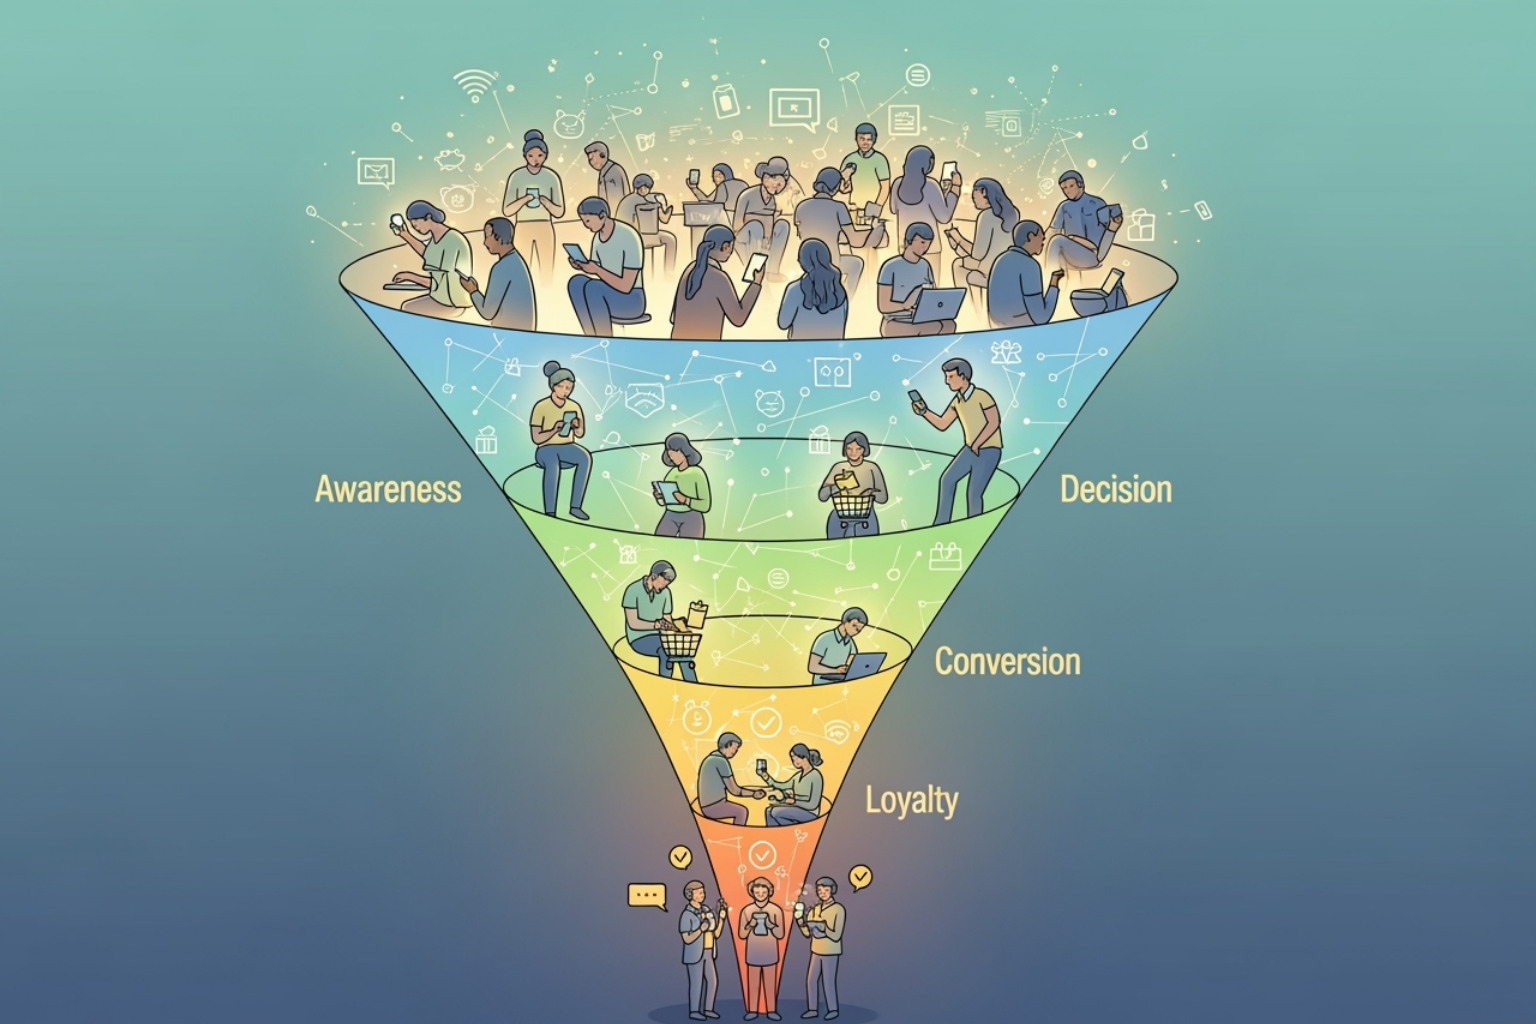
A customer's experience breaks into five stages. Shoppers rarely move through them in a straight line — they jump back and forth — but the stages are a useful way to organize the map.
1. Awareness
The shopper realizes they have a need and may not know the brand yet. Discovery happens through social ads, search, content, word of mouth, or referrals. The objective at this stage is visibility: showing up where the problem is being researched, with content that speaks to that problem rather than to the product's feature list.
2. Consideration
The shopper now knows the brand and is comparing options. They read reviews, study product pages, and weigh alternatives, asking "is this right for me?" and "how does it compare?" A retailer like Bliss World earns this stage with detailed product information and visible social proof. The objective is to make the case clearly: strong product detail, accurate imagery, and reviews that build confidence.
3. Acquisition (purchase)
The shopper is ready to buy, so the checkout has to be clean. Adding to cart, entering payment, and choosing shipping are where most of the ~70% cart-abandonment loss occurs — usually from unexpected costs, forced account creation, or too many steps. Accelerated checkout options such as Shop Pay reduce that friction. The objective is a transparent, low-step, secure path to purchase, with all costs shown before the final screen.
4. Retention
The sale is the start of the relationship, not the end. Order confirmations, accurate tracking, the unboxing experience, responsive support, and consistent product quality all decide whether a first-time buyer returns. Because retaining a customer is far cheaper than acquiring a new one, this stage often carries the highest return on effort. The objective is to keep the post-purchase experience as deliberate as the pre-purchase one.
5. Advocacy
Satisfied customers become a marketing channel of their own — leaving reviews, sharing user-generated content, referring friends, and joining loyalty programs. Recommendations from people a shopper already knows remain among the most trusted forms of marketing, which is why advocacy is worth designing for rather than waiting on. The objective is to make sharing easy: prompt reviews, run a referral program, and give repeat buyers a reason to stay engaged.
How to build an ecommerce customer journey map
With the stages defined, the map turns scattered data into an actionable plan. The work is closer to detective work than design: gather evidence, then assemble it into a picture of where customers struggle.
Step 1: Set goals and define a persona
Start with one or two specific goals — reduce cart abandonment, or increase repeat purchase rate — rather than trying to fix everything at once. Then build a customer persona: a concrete profile of the target shopper with a name, context, and motivations ("Sarah, a time-pressed parent who values fast shipping"). The persona forces the map to reflect the customer's point of view instead of the store's. A persona builder can speed this up.
Step 2: List every touchpoint
A touchpoint is any interaction with the brand. Brainstorm these across teams, since each department sees different ones — marketing knows the ads and newsletters, support knows the chats and tickets. Include the smaller touchpoints too: search results, product-page visits, confirmation emails, and shipping notifications. Begin with the obvious ones and add detail over time.
Step 3: Gather and analyze data
Base the map on real data, not assumptions — the most common failure is mapping from opinion. Pair quantitative sources, which show what is happening, with qualitative sources, which explain why.
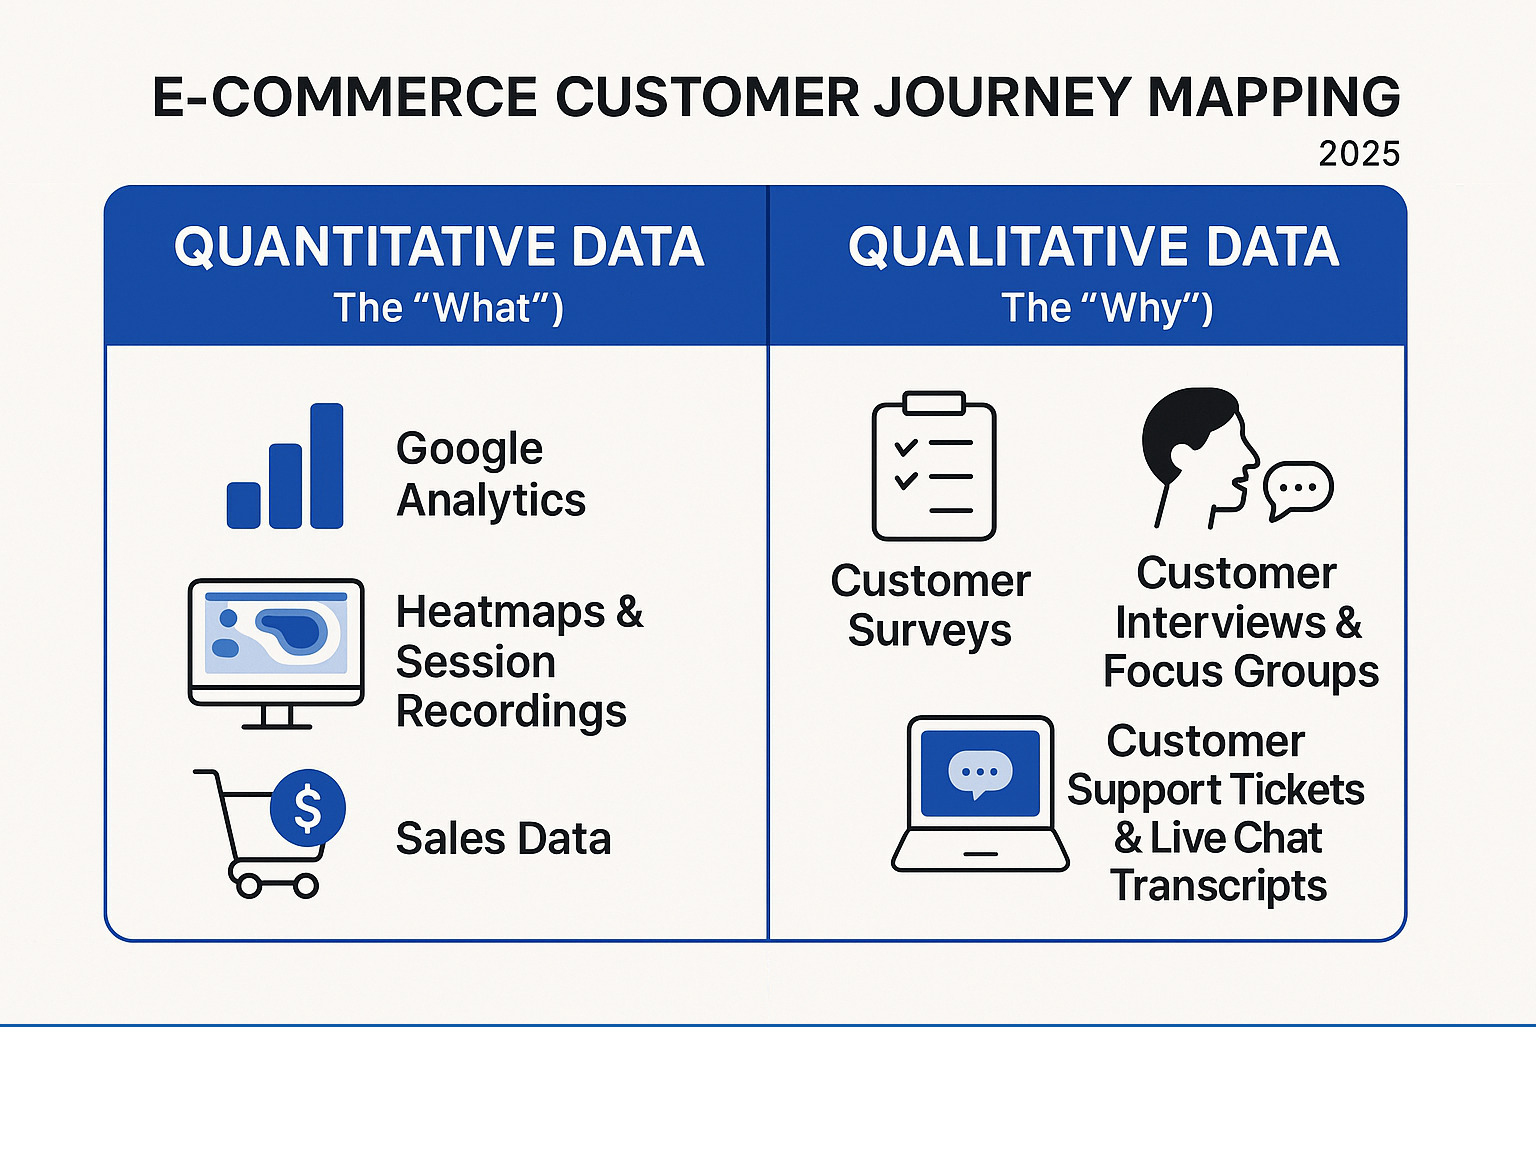
| Quantitative data (the "what") | Qualitative data (the "why") |
|---|---|
| Analytics (e.g. GA4 path exploration) — traffic sources, conversion rates, and drop-off points | Surveys (Typeform, SurveyMonkey) — direct input on experience, pain points, and suggestions |
| Heatmaps & session recordings (e.g. Hotjar) — where users click, scroll, and stall | Interviews & focus groups — motivations and emotions behind the behavior |
| Sales data (AOV, customer lifetime value) — purchasing patterns and customer value | Support tickets & chat transcripts — recurring frustrations and questions |
| Social analytics — engagement, reach, and sentiment | Reviews & social comments — unsolicited, candid feedback |
Structured customer feedback analysis is what connects the two: the numbers flag where people leave, and the feedback explains the reason. Treat collection as ongoing — the map improves as the evidence accumulates.
Step 4: Visualize the experience and find pain points
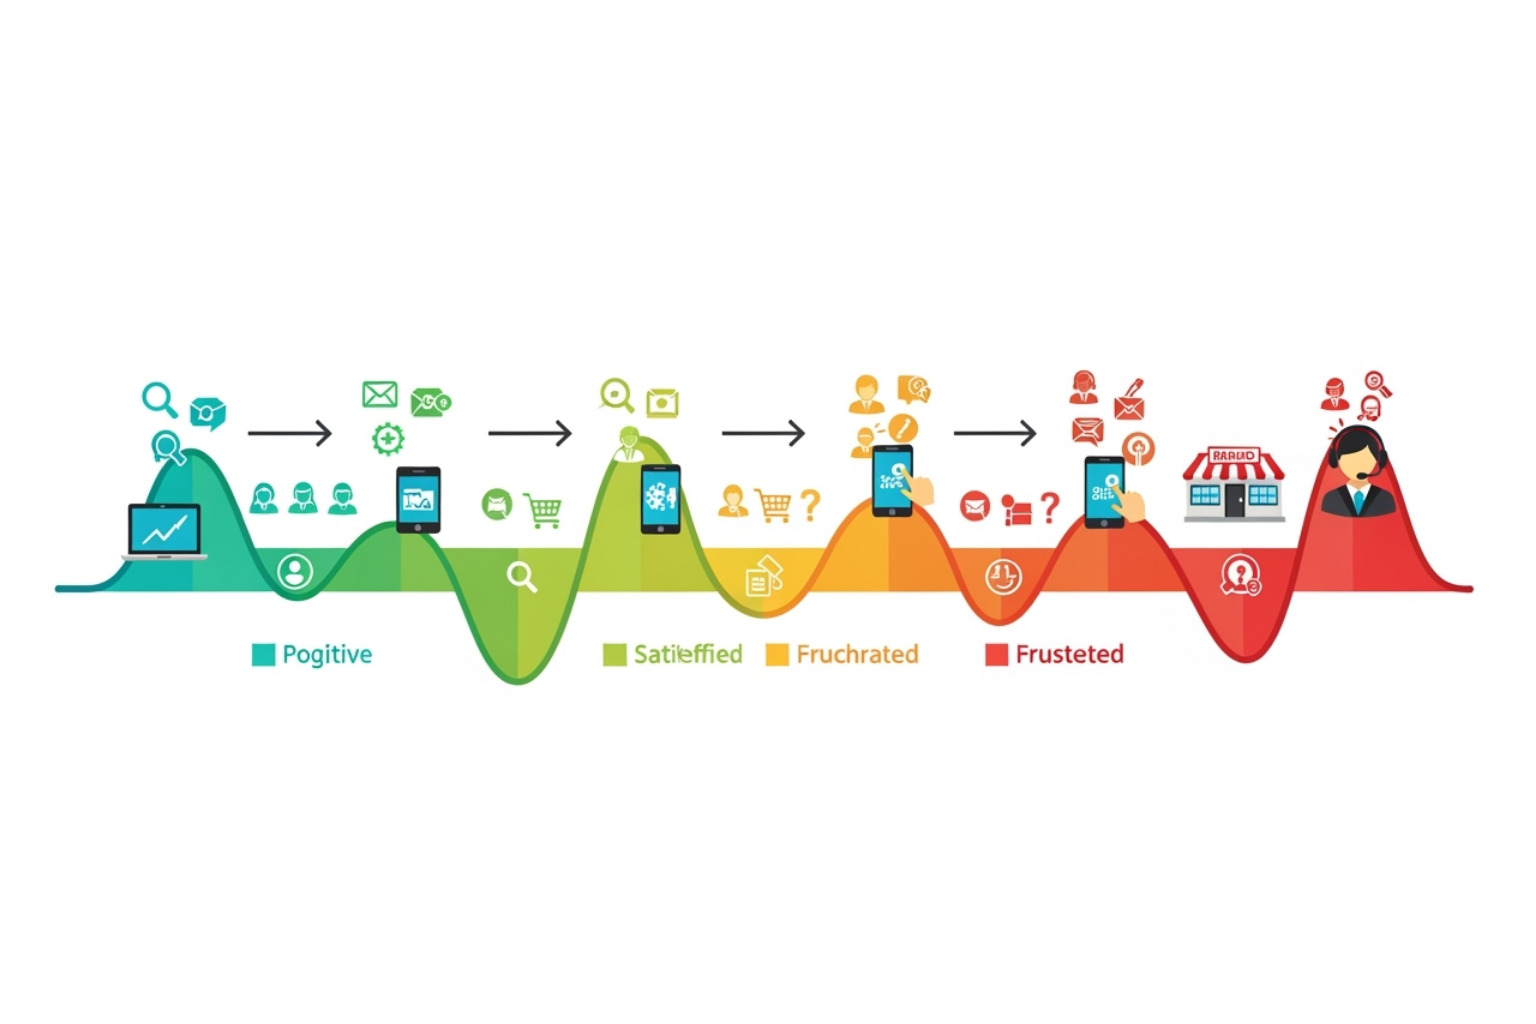
Build the map on whatever medium works — whiteboard, spreadsheet, or dedicated software. The tool matters less than the insight. For each stage, plot four rows:
- Actions: what the customer is doing (searching, comparing, adding to cart)
- Touchpoints: where it happens (search, product page, email)
- Thoughts and feelings: the emotional state at that step (curious, reassured, frustrated)
- Pain points: where friction or confusion appears — these are the improvement targets
Filled in across all five stages, the map exposes patterns — a cluster of frustration around shipping updates, say — and points directly to what to change.
Putting the map to work
A finished map is a working document, not an archive. Its value is in the changes it drives.
Reduce friction at the worst touchpoints
Start with the largest pain points the map revealed. If abandonment spikes at checkout — the dominant driver of that 70% rate — the fixes are often straightforward: offer guest checkout, show all costs upfront, and cut the number of steps. Smaller adjustments compound too, like surfacing reviews on the product page or adding reassurance copy at checkout.
Personalize the experience
Once the path is understood, the experience can be tailored without heavy software. Show related products from browsing history, or send a follow-up email matched to what the customer bought — hiking socks after hiking boots, brewing tips after a coffee maker. Relevance signals that the store understands the customer, which supports repeat purchases.
Optimize for mobile
With roughly half of web traffic on mobile, a weak mobile experience turns away a large share of shoppers. Walk the journey on a phone: is browsing easy, are tap targets large enough, does checkout hold up? Test across devices, or use Google's mobile-friendly test. The aim is a native-feeling mobile flow, not a shrunken desktop site.
Frequently asked questions
What are the five stages of the ecommerce customer journey?
Awareness, consideration, acquisition, retention, and advocacy. Awareness is first discovery; consideration is research and comparison; acquisition is the purchase itself; retention covers the post-purchase relationship; and advocacy is when satisfied customers refer others. Shoppers often move between stages rather than straight through them.
How do you create an ecommerce customer journey map?
Set one or two clear goals, define a customer persona, list every touchpoint, then gather quantitative and qualitative data to see where shoppers struggle. Plot each stage with the customer's actions, touchpoints, emotions, and pain points, then prioritize the friction points to fix. Update the map as new data comes in.
What is the difference between a customer journey map and a sales funnel?
A sales funnel measures conversion — how many people move from one step to the next toward a purchase. A journey map is wider: it captures the customer's actions, emotions, and obstacles across the full relationship, including retention and advocacy after the sale. The funnel tells a store where people drop off; the map helps explain why.
How often should a customer journey map be updated?
Review it at least quarterly, and sooner after any major change — a site redesign, a new checkout flow, a shift in customer base, or a new product line. Customer behavior and expectations move, so a map left untouched for a year usually no longer reflects reality.
Next steps
A customer journey map replaces guesswork with evidence: it shows exactly where an online store loses shoppers and where the experience can be improved. First Pier is an ecommerce agency in Portland, Maine that builds and optimizes Shopify storefronts. To map your store's customer journey and act on what it reveals, get in touch.





.png)
.png)

