




Why an Ecommerce A/B Testing Guide Is the Highest-ROI Tool You're Not Using Systematically
Summary
- An ecommerce A/B testing guide outlines how to compare two versions of a page or element to find which one drives more revenue.
- The average ecommerce conversion rate is 2.5–3.2%. Top-performing stores hit 5.5% — a gap that represents a 120% revenue difference on identical traffic.
- Structured testing programs generate 25–40% cumulative annual conversion improvements through stacked individual wins of 5–15%.
- Only 12% of test ideas produce a statistically significant positive result, which makes prioritization and statistical rigor non-negotiable.
- Valid tests require a minimum of 95% confidence, 80% statistical power, and enough traffic to reach a pre-calculated sample size before calling a winner.
Here at First Pier, we developed this ecommerce A/B testing guide because we constantly see stores leaving measurable revenue on the table — not from a lack of traffic, but from making site changes based on opinion rather than evidence.
Consider this: a store generating $5 million annually at a 2.5% conversion rate can add $200,000 in incremental revenue by moving that rate to just 2.75%. No extra ad spend. No new product lines. Just a better-performing page.
The problem isn't that store owners don't test. It's that most tests are run wrong — launched without enough traffic, called too early, or built around gut instinct instead of behavioral data. According to an Optimizely analysis of over 127,000 experiments, only 12% of test ideas actually produce a statistically significant positive result. That means 88% of changes pushed live without testing either do nothing or actively hurt performance.
The stores closing the gap between average and top-tier conversion rates share one thing: a systematic, always-on testing program — not occasional, one-off experiments.
This guide walks through everything needed to build that program: from forming a valid hypothesis, to calculating the right sample size, to prioritizing which tests to run first, to reading results without falling into common statistical traps.
What is Ecommerce A/B Testing and Why It Matters
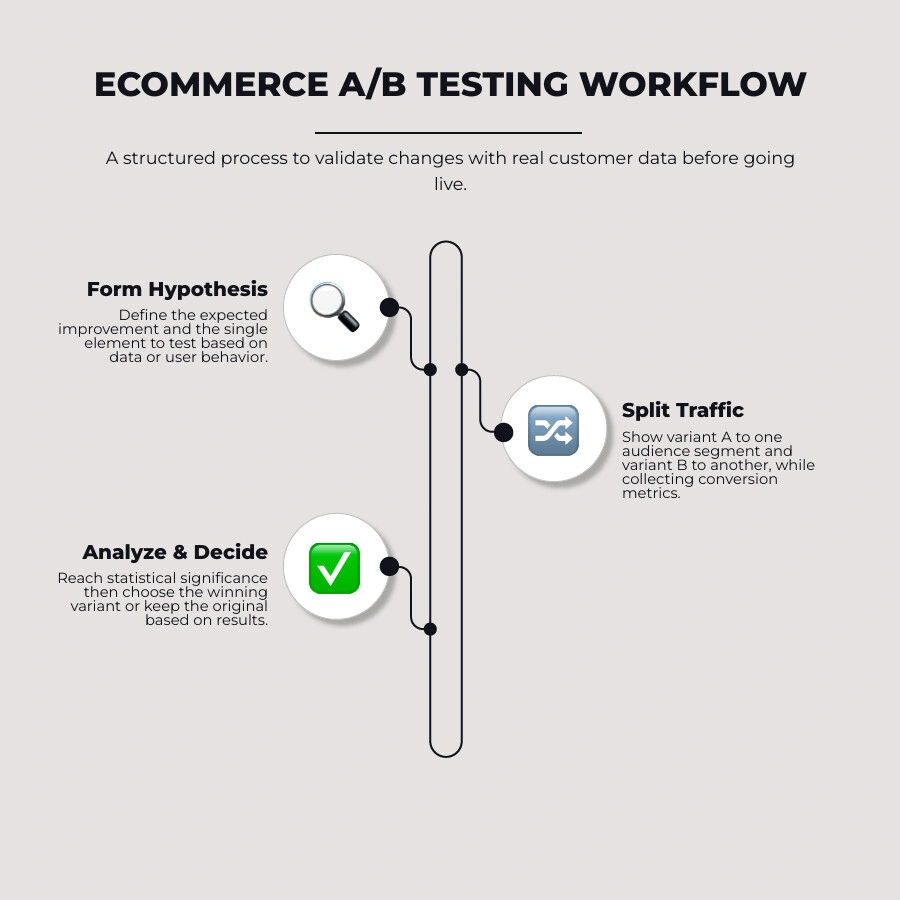
At its core, A/B testing (also known as split testing) is the scientific method applied to digital retail. Instead of debating which page layout or promotional offer feels better, you present different versions to different segments of your actual audience and let their purchasing behavior decide the winner.
By running these controlled experiments, you build a deep understanding of your customers, improve the user experience, and make data-backed decisions that directly increase your average order value (AOV) and conversion rate.
Split Testing vs Multivariate Testing
While the terms are sometimes used interchangeably, split testing and multivariate testing serve different purposes:
- Split Testing (A/B/n): You compare two or more distinct versions of a webpage (Control A vs. Variant B) to measure the impact of a single major variable. For example, you might test a single-page checkout against a multi-page checkout. This is the workhorse of Conversion Rate Optimization because it requires less traffic to reach statistical validity.
- Multivariate Testing (MVT): You test multiple combinations of elements on a single page simultaneously. For instance, you might test three different hero images combined with two different call-to-action (CTA) button colors. While MVT helps you understand how different elements interact, it requires massive traffic. A standard A/B test might require 5,000 to 50,000 visitors per variant, whereas an MVT can easily require 100,000+ visitors to produce reliable data.
For 90% of ecommerce brands, standard split testing is the most efficient path to reliable revenue growth. You can learn more about structured testing strategies in this A/B Testing for Ecommerce Guide.
Why Every Store Needs an Ecommerce A/B Testing Guide
Relying on industry "best practices" is a risky way to run an online store. What works for a massive marketplace might fail on a boutique apparel site.
A structured testing program helps you combat rising customer acquisition costs (CAC) by converting a higher percentage of the traffic you already pay for. When you improve your site's performance, you also support your search engine optimization (SEO) efforts. High-performing pages engage users longer, reduce bounce rates, and signal to search engines that your site provides a high-quality experience.
Furthermore, 73% of shoppers expect brands to understand their unique needs and expectations. Systematic testing allows you to refine customer profiles and build experiences tailored to how people actually shop. According to Harvard Business School research, companies that adopt systematic testing see performance improvements of 30% to 100% within a year. For deeper insights into building a testing culture, read this guide to higher conversions.
How to Use This Ecommerce A/B Testing Guide
To build a testing program that yields real results, you must move away from ad-hoc changes. You need a repeatable workflow that turns ideas into structured experiments. This workflow relies on four key steps: research, hypothesis, calculation, and prioritization. This structured approach forms the backbone of any successful ecommerce conversion strategy.
Prerequisites for Using This Ecommerce A/B Testing Guide
Before you run your first experiment, you must ensure your store has the baseline traffic and tracking infrastructure required to yield valid results.
If your store has low traffic, traditional A/B testing can take months to produce a single statistically significant result. As a general rule, a store needs a minimum of 10,000 monthly visitors or 200+ monthly transactions to run meaningful tests. To detect a 10% relative lift in conversion rate, you typically need 350 to 400 conversions per variant.
You must also verify that your analytics tool (such as Google Analytics 4) is tracking events accurately. If your add-to-cart, checkout initiation, and purchase events are not firing correctly, your test data will be useless. For a complete technical walkthrough on setting up your store for testing, review this Shopify A/B testing setup guide.
Prioritization Frameworks: PIE and ICE
Once you start researching user behavior using heatmaps, session recordings, and funnel analytics, you will quickly generate dozens of test ideas. You cannot test everything at once. To prevent wasted test cycles, use a prioritization framework like PIE or ICE to score and rank your backlog.
The PIE Framework ranks ideas on a scale of 1 to 10 across three metrics:
- Potential: How much improvement can be made on this page? (e.g., a checkout page with a 70% drop-off rate has high potential).
- Importance: How valuable is the traffic on this page? (e.g., product pages and cart pages are more important than your privacy policy page).
- Ease: How simple is it to build and implement this test? (e.g., changing CTA button copy is much easier than redesigning the entire site navigation).
The ICE Framework uses a similar approach, scoring ideas based on:
- Impact: How much of a conversion lift will this change produce if it succeeds?
- Confidence: How sure are you that this hypothesis is correct, based on qualitative and quantitative data?
- Ease: How much time and technical resource will it take to launch?
By averaging these scores, you can focus your resources on high-impact, low-effort changes first. For a detailed breakdown of prioritization, refer to this comprehensive A/B testing guide.
High-Impact Elements to Test on Your Store
When starting out, focus your testing program on the pages where users show the highest buying intent. Optimizing your product detail pages, shopping cart, and checkout flow yields the fastest conversion lifts. You can explore targeted optimization concepts in this guide to Shopify store conversion rate optimization.

Homepage and Hero Images
Your homepage is often the first touchpoint for new visitors, making it a critical area for setting expectations and establishing trust.
- Hero Images vs. Carousels: Multiple studies show that sliding carousels frustrate users because they move too quickly and look like ads. Test a high-resolution, static hero image with a single, clear value proposition against a carousel to measure the impact on click-through rates.
- Navigation Menus: Test a simplified, category-focused menu layout against a complex "mega-menu" to see which helps users find products faster.
- Promotional Pop-ups: Test the timing of your email capture pop-ups (e.g., immediate entry vs. 15-second delay vs. exit-intent) to balance list growth with bounce rates.
Product Detail Pages and CTAs
Your product detail page (PDP) must answer every question a buyer has while removing friction. To learn more about PDP layout optimization, read Fawad Hussain Syed's guide to PDP split testing.
- Call to Action (CTA): Test the size, color, and copy of your primary "Add to Cart" button. Ensure secondary CTAs (like "Add to Wishlist") are visually smaller or less prominent so they do not compete with your primary goal.
- Product Image Layout: Compare a vertical thumbnail strip against a horizontal carousel, or test lifestyle imagery against clean, white-background studio shots.
- Social Proof Placement: Test placing customer star ratings and review summaries directly below the product title versus burying them at the bottom of the page.
Cart and Checkout Optimization
Cart abandonment is one of the largest revenue drains in ecommerce, with an industry average abandonment rate of 69%.
- Shipping Threshold Displays: Extra costs at checkout are the top reason for cart abandonment. Test displaying your free shipping threshold prominently in bold text throughout the cart and header. Compare "Free shipping on orders over $75" against including shipping costs in the base product price.
- Checkout Layout: Run an experiment comparing a modern, single-page checkout against a multi-step checkout flow.
- Trust Badges: Test placing security badges and payment icons directly below the final "Pay Now" button to reassure anxious buyers. For more ideas across the entire funnel, review this guide to ecommerce testing ideas.
Statistical Rigor: Running Valid Experiments
The biggest mistake ecommerce merchants make is calling a test winner too early. If you push a change live simply because it looks good after four days, you are likely making decisions based on statistical noise. To run valid experiments, you must understand a few basic statistical concepts.
| Concept | Definition | Target Benchmark |
|---|---|---|
| Statistical Significance | The probability that the difference in performance between your variants is not due to random chance. | 95% or higher |
| Statistical Power | The probability that your test will detect an actual effect if one exists. | 80% or higher |
| Minimum Detectable Effect (MDE) | The smallest relative lift in your primary metric that you want your experiment to detect. | Typically 5% to 10% |
Determining Sample Size and Duration
Before launching any test, you must calculate your required sample size using your baseline conversion rate, desired MDE, statistical power, and significance level.
Once the test begins, you must run it until you reach that pre-calculated sample size. Furthermore, you must run the test for a minimum of two weeks (14 days) to account for weekly shopping cycles. For example, user behavior on a Tuesday afternoon is often vastly different from behavior on a Sunday morning. Stopping a test early because it reached 95% significance after five days is a common error that leads to false positives.
Statistical Significance vs False Positives
If you run a test to 95% significance, there is still a 5% chance that the result is a false positive. If you change your success metric halfway through an experiment, or stop a test the moment the curve looks positive, you are engaging in "p-hacking."
To prevent this, stick to your primary metric (such as add-to-cart rate or conversion rate) and do not implement changes until the test has run its full duration and reached its target sample size.
Frequently Asked Questions about Ecommerce A/B Testing
What is the average ecommerce conversion rate in 2026?
The average global ecommerce conversion rate in 2026 hovers between 2.5% and 3.2%. However, top-performing stores routinely hit 5.5%. Conversion benchmarks also vary significantly by region and industry sector. For example, Great Britain sees average conversion rates around 4.4%, while the United States sits closer to 2.8%.
How long should an ecommerce A/B test run?
An ecommerce A/B test should run for a minimum of two weeks (14 days) and a maximum of four weeks. Running a test for less than two weeks ignores weekly purchasing cycles, while running a test for more than four weeks increases the risk of cookie deletion, which can corrupt your audience segmentation.
Can A/B testing hurt my store's SEO?
No, A/B testing will not hurt your store's SEO if you follow search engine guidelines. When running redirect tests, use temporary 302 redirects instead of permanent 301 redirects. Always use canonical tags on your variant pages pointing back to the original control page, and never show different content to search engine crawlers than you do to human visitors (a prohibited practice known as cloaking). You can watch this video guide to ecommerce testing for more details.
To Sum Up
To sum up, a structured ecommerce A/B testing program is the most reliable way to convert your existing traffic into compounding revenue. By replacing opinions with validated data, you can systematically remove friction from your customer journey and increase your store's profitability without increasing your ad spend.
If you want to build a structured testing program that turns traffic into revenue, get in touch with our team here at First Pier.





.png)
.png)

